Sample plan
A good income, and it still doesn't fund retirement.
Most sample plans show you someone who succeeds in fulfilling their goals. We think it's more instructive to start with a household that doesn't — because that is the more common situation. What a planning tool does when the answer is "not yet" is instructive.
The household
- Age
- 40, planning to age 90
- Household income
- $250,000
- Invested today
- $80,000
- Saving
- $10,000 a year — about 3% of income — until 65
- College
- $25,000 a year for 4 years, starting at 47
- Retirement spending
- $150,000 a year from 65
- Social Security
- $63,000 a year from 67
- Allocation
- Balanced
What our projection says
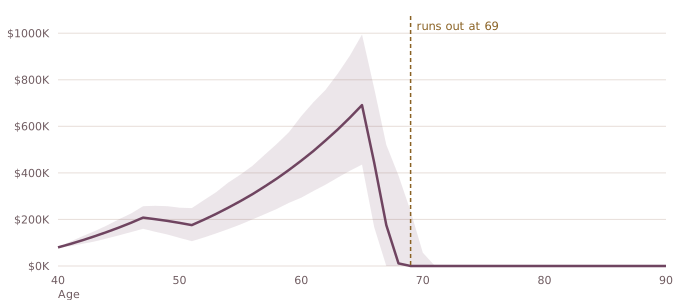
The portfolio peaks around $691,143 at retirement and is exhausted four years later. Across the thousand simulations run, the portfolio never runs out in 0% of them — not one path in a thousand.
Nothing here is unusual. A high income and a 3% savings rate is an ordinary combination, and the gap only becomes visible when you put the whole life on one timeline.
The useful bit
A verdict on its own is not worth much. We also need to identify the changes that move it.
| Change | Never runs out | Money runs out |
|---|---|---|
| Nothing — as it stands | 0% none of the 1,000 | age 69 |
| Save $30,000 a year instead of $10,000 | 9.6% | age 79 |
| Spend $100,000 a year in retirement instead of $150,000 | 1.7% | age 73 |
| Both together | 78.2% | doesn't |
Saving three times as much buys ten more years and still fails. Cutting retirement spending by a third barely registers on its own. Together they fund 43 years and the plan holds.
That interaction is the thing a spreadsheet rarely shows and a rule of thumb never does. It is also why the product does not lead with a single number — the number moves for reasons, and the reasons are what you can act on.
What this illustration does not do
It does not model taxes on withdrawals, an inheritance, insurance or annuity products, or a change in the allocation over time. It assumes a fixed inflation rate and a single retirement date. Those are real limitations, and the product says so in the plan itself rather than in a footnote.
No card required.
See how it works or what it costs.